AWS Builder Vault Operations
Health System
This section helps you understand the wallet metrics displayed on the AWS CloudWatch dashboard and provides insights into maintaining the overall health of the Builder Vault system.
Cloudwatch Dashboard
The AWS Marketplace offering comes standard with AWS CloudWatch dashboards for your nodes. Here is an example of a static 2-node deployment configuration. You can access your dashboard using the Cloudwatch dashboard for your node infrastructure. Depending on if you are looking for the core node stack or the expansion node stack, you’d navigate to:
- Core Stack -
<namespace>-<env>-core-nodes - Expansion Node Stack -
<namespace>-<env>-node-<index>
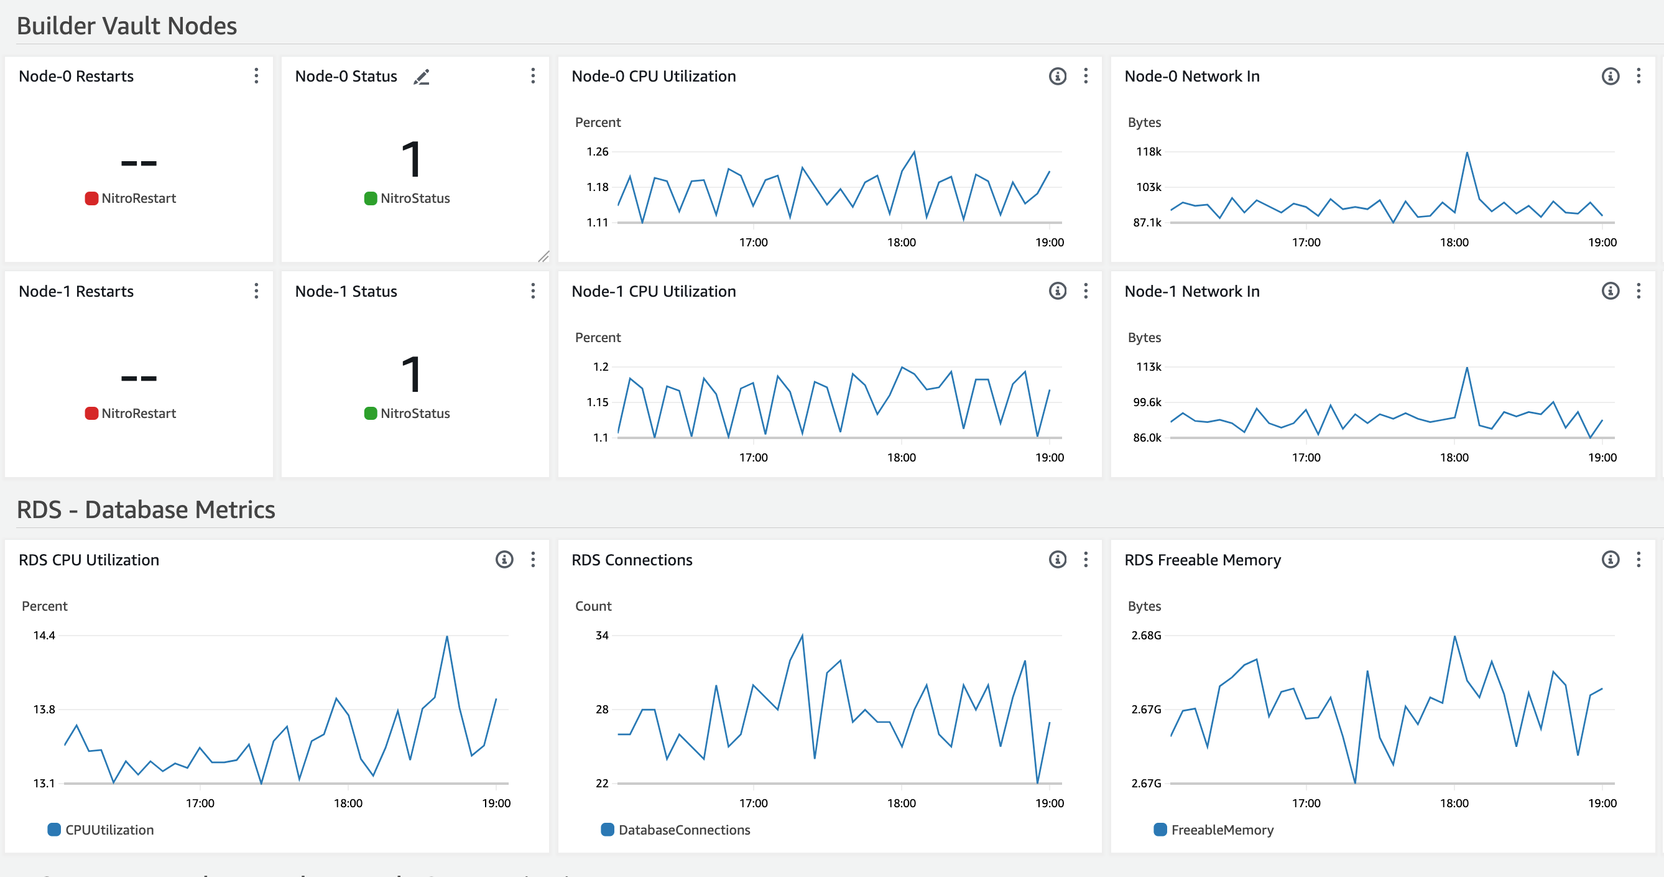
Note:A nitro status of
1means that your nodes are online and health checks passing0or lower would signify that the nodes are not healthy.
Health Status for the Builder Vault service
To maintain smooth operations, each service within the deployment provides a /ping endpoint. This endpoint is responsible for indicating the health status of the service through HTTP status codes. Follow the steps outlined below to ensure the system's reliability.
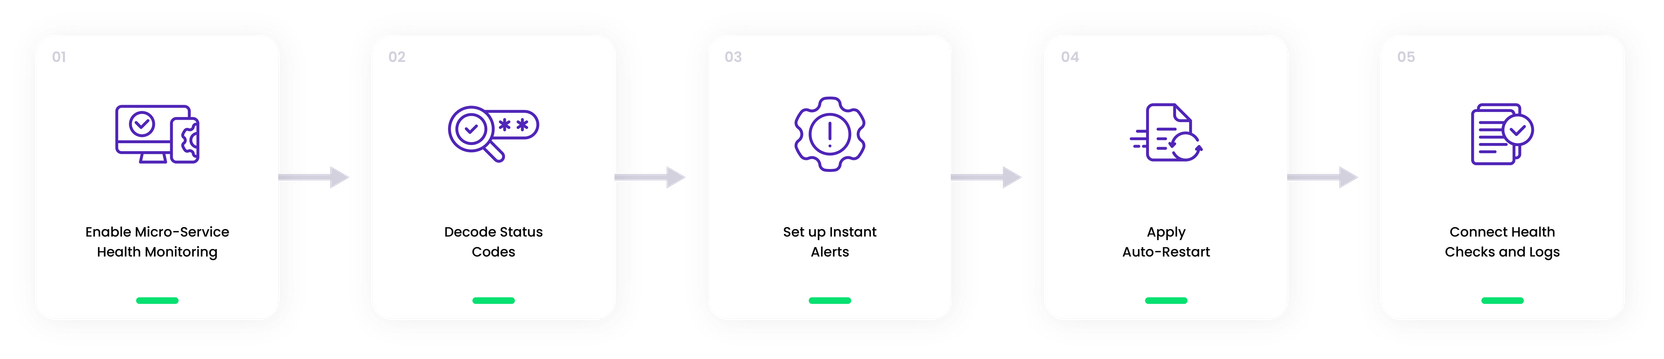
1. Enable Service Health Monitoring
For optimal service performance, consistently check the /ping endpoint, which reflects the current status.
2. Decode Status Codes
The /ping endpoint status codes reveal service health. 200 - OK indicates success; others like 503 - service unavailable suggest possible issues.
3. Set up Instant Alerts
Arrange to receive notifications when /ping status codes deviate from 200 for rapid issue resolution.
4. Apply Auto-Restart
When a service repeatedly fails health checks, trigger an automatic restart. Fine-tune the number of failures needed to invoke this to ensure system stability.
5. Connect Health Checks and Logs
Link health checks with logs for additional failure cause insight, aiding in swift problem resolution.
Builder Vault Node Troubleshooting
Troubleshooting a confidential computing environment differs from a regular application because of the challenges of running an enclave container in protected mode. However, we have compiled a series of operations that can be done given the various scenarios to make troubleshooting a possibility without compromising the underlying security.
Troubleshoot a Node
This tutorial will show you a step-by-step guide to troubleshooting a node that might go down for various reasons.
Check a node's health
- Check the status of a node by logging into the EC 2 instance.
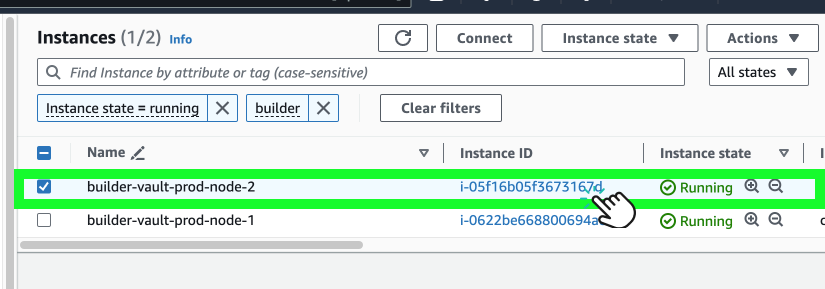
- Select an EC2 instance to troubleshoot.
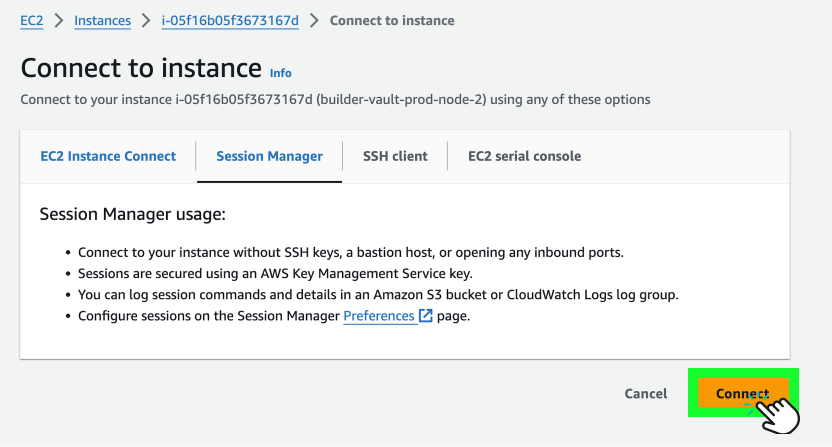
- Click the Connect button to open an SSM terminal session.
- To have permission to troubleshoot the instance, use the following
sudocommand:
sudo su
journalctl -f -u enclave.service
Note:You can also create alarms in the CloudWatch dashboard for when the node status is outside of your respective levels.
Edit the Configuration Files
Due to the sensitive nature of the Builder Vault MPC configuration files and the multi-party requirement, these configurations are stored within the KMS Stack resources. Upon startup, the infrastructure accesses these assets. For troubleshooting a node, access to the corresponding KMS Stack is essential for entering debug mode for the specific configuration. However, as an admin, you can view these configuration files without secrets to identify any configuration issues, as they do not contain secret material.
To edit the files:
- Navigate to the following S3 bucket path in the deployed KMS stack.
s3://<namespace>-<accountId>-<region>-node-<index>-bucket/node-<index>/config.tomlYou need to have access to the deployed KMS stack to edit the instance configuration.
Note:Node index is the player index of the Builder Vault instance. These will all be unique for each MPC player.
- Download, edit, and re-upload the custom configuration files to the specified location.
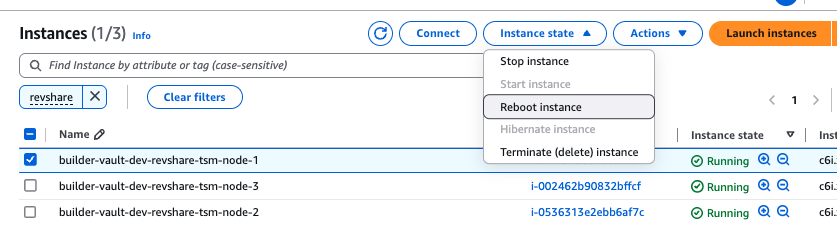
- After uploading, restart each node via the EC2 console by navigating to the corresponding EC2 instance. Select Instance State -> Reboot Instance.
Enter the Nitro Debug Mode
AWS Nitro secure enclaves operate in a protected environment, isolating memory, storage, and network, preventing standard logging to stdout. However, operators can enable logging by accessing the node's KMS Stack and placing the node into Nitro debug mode, facilitating visibility into log outputs during debugging. To place a node in Nitro Debug mode, follow the steps below:
- Find the node's KMS Stack and locate the
ShardKMSKeyNitroresource, which secures the Nitro envelope encryption key. Adjust the policy to enable debug mode for the node. - Click on the Link to navigate to the specific KMS key.

- Click the Edit button.
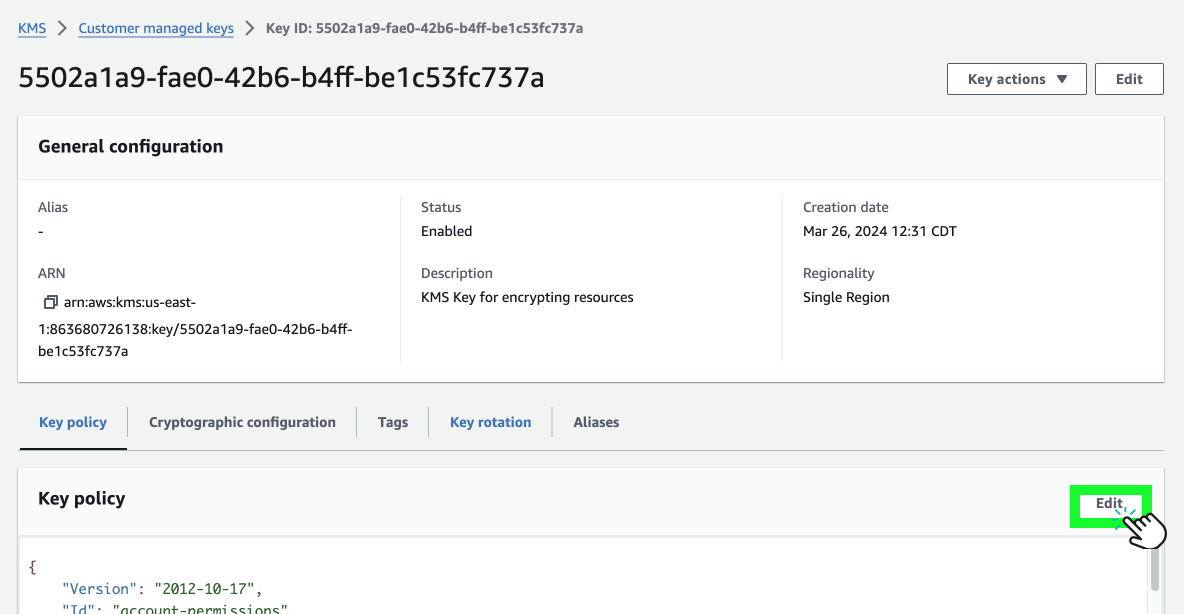
- Change the key policy value to:
"kms:RecipientAttestation:PCR8": "000000000000000000000000000000000000000000000000000000000000000000000000000000000000000000000000"- To access debug mode on the nitro instance, log in to the Nitro EC2 instance you selected.
- Shut down and restart the selected nitro by using the following command:
cd /app
sudo DEBUG_MODE="--debug-mode" ./restart-enclave.sh; nitro-cli console --enclave-name enclave- This will open a nitro console that will tail the application logs.
- Start the enclave service in
protected mode, in the node EC2 instance, type in the following command:
sudo ./restart-enclave.sh; nitro-cli console --enclave-name enclave
Note:When finished debugging, revert the KMS policy back to the initial settings, and restart the enclave service.
AWS ERS Instructions
This section provides step-by-step instructions for configuring Emergency Recovery Service (ERS) for TSM deployed via AWS Marketplace.
- Stop all the static and dynamic nodes currently running.
- Update the config file for each node (static 0, 1, and any dynamic) and add the ERS configuration (see below). Example s3 file path: 123456789012-dev-tsmdemo-tsm-config-bucket/tsmdemo-0/config.toml.
- Turn all the nodes back on.
- Follow the below process to use the ERS.
- Turn the nodes off.
- Remove the ERS config from each config file.
- Turn nodes back on.
Updated 10 months ago